Uncover Competitor Tactics
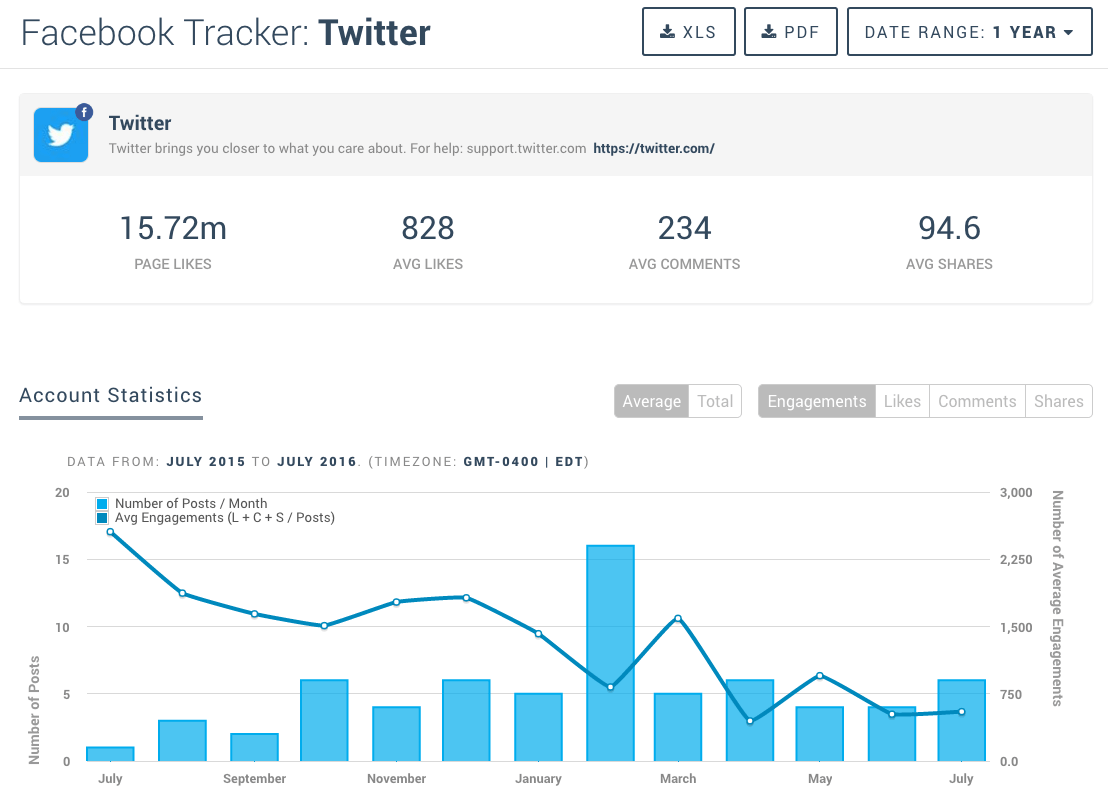
Keyhole unlocks competitor strategies, allowing you to access their activity, engagement and development data. Track their Facebook pages to see which tactics work and fail with your target audience. Then, compare and contrast them with metrics from your own page to benchmark growth and engagement standards.

Optimize Posting
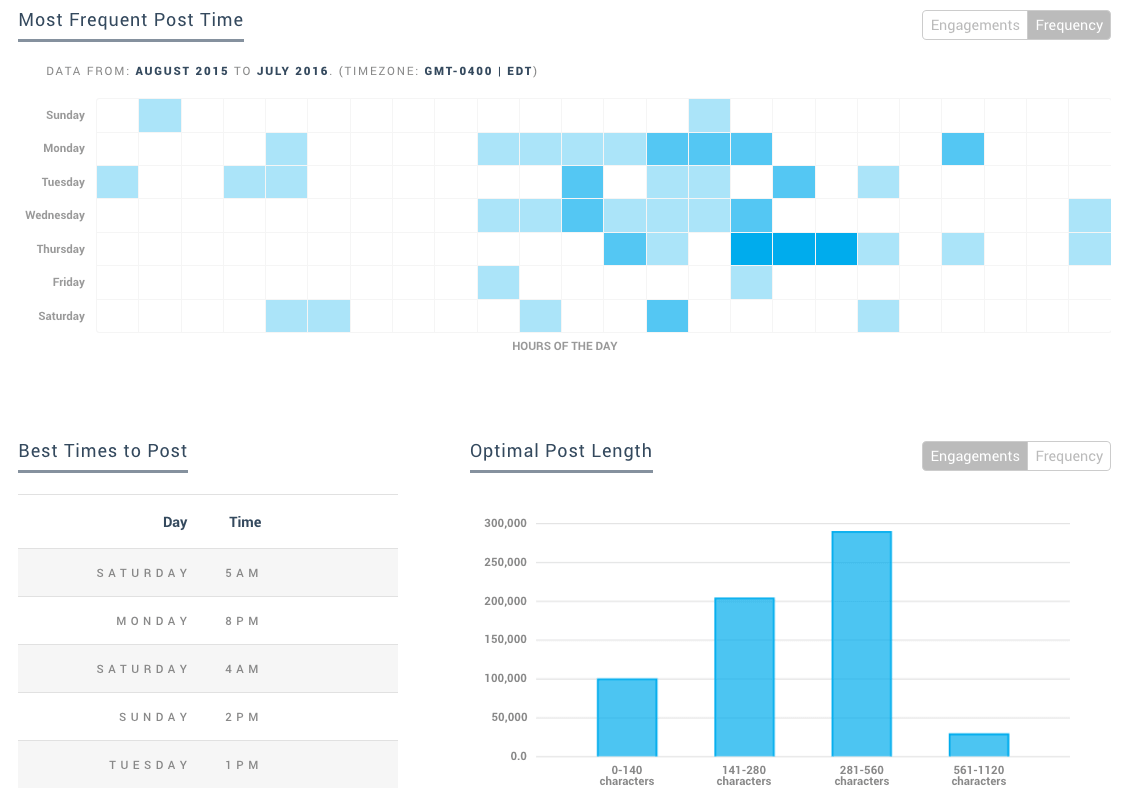
Keyhole’s Facebook analytics platform delivers a suite of optimization data, depicting how to craft engaging posts and when to share them. Learn which updates earn the most interaction based on media, character count and posting times. See it all in easy-to-read charts and graphs.

Accelerate Fanbase Growth
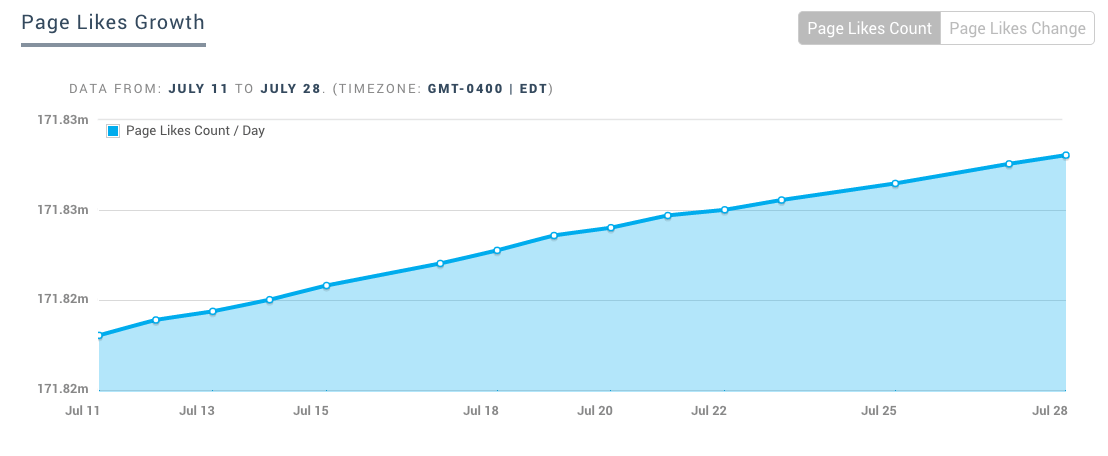
Keyhole collects data about page like growth and fluctuation at daily, monthly and yearly levels. Create audience-building strategies by examining how your user base develops in relation to post type, update volume and engagement stats.

Automate Facebook Reporting
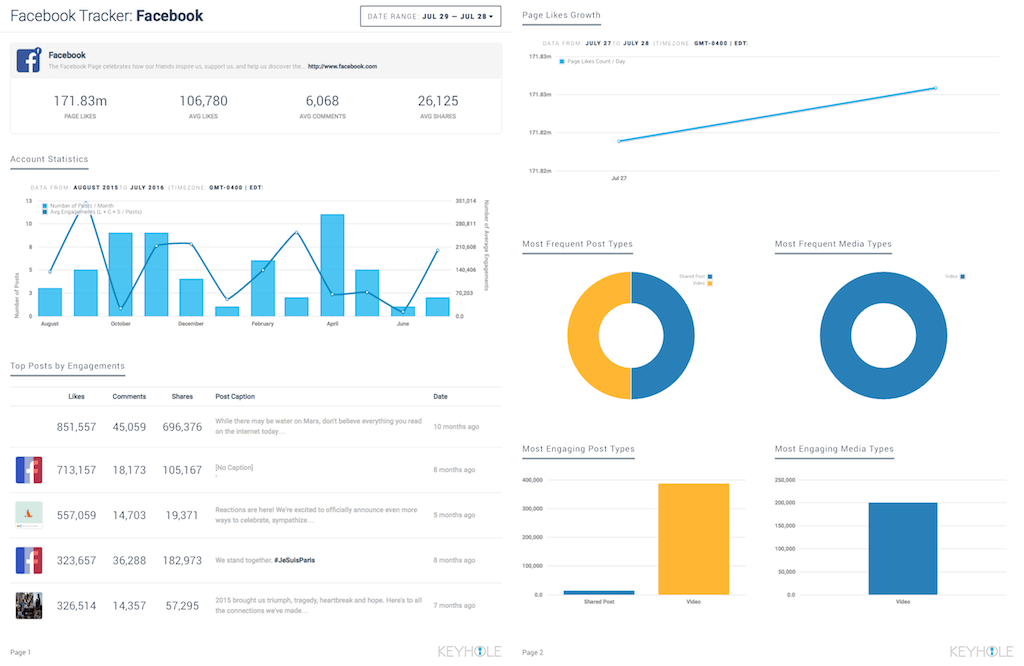
Keyhole offers analytics reports that contain key metrics such as page like growth, engagement rate and optimal posting times. Use these insights to adjust your approach or stay the course. After, celebrate news of KPI growth with clients and team members by sharing your dashboard with them, or downloading and printing a PDF or Excel report.
